Please
enable JavaScript
in your browser - we need them for the 'browse by tag' navigation. Thanks!
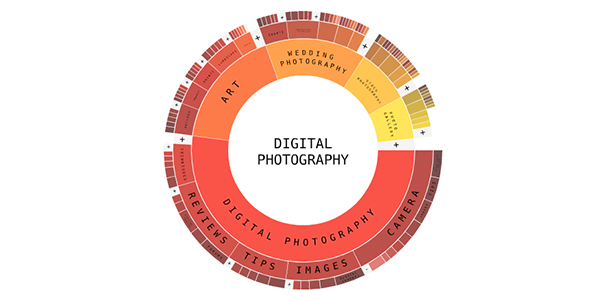
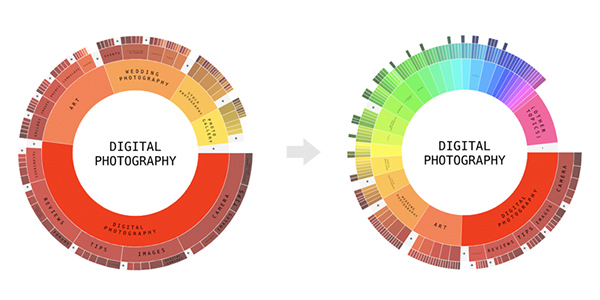
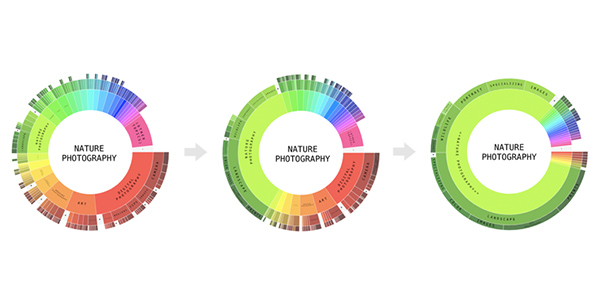
carrot2
Clustering Engine
visualization
interface
web
flash
experimental
[080201]
Back
This work is licensed under a
Creative Commons Attribution-Noncommercial-No Derivative Works 3.0 License
, unless otherwise noted.